
Performance testing gives you thousands of numbers, but numbers alone don't tell a story. What really matters is how quickly you can turn raw test data into clear, actionable insights.
That's where HTML reports in JMeter come in. Instead of digging through bulky log files, you get clean dashboards, interactive graphs, and easy-to-share performance summaries, all in just a few clicks (or a single command).
In this guide, you'll learn exactly how to generate HTML reports in JMeter, whether you're using the latest JMeter version or an older setup, and whether you prefer GUI or Non-GUI mode. Simple steps, no confusion, just results.
What Is an HTML Report in JMeter?
An HTML report in JMeter is a visually rich performance dashboard that converts raw test data into:
- Response time graphs
- Error percentage reports
- Throughput statistics
- User load trends
- 90th, 95th, and 99th percentile values
- Active threads and server behavior
Instead of reviewing large .jtl files, you get a clean web-based dashboard that makes it easy to analyze performance bottlenecks and share results with clients and stakeholders.
Why HTML Reports Are Important
Modern software systems are now:
- Cloud-hosted
- Microservices-based
- API-driven
- Scaled for thousands of users
Because of this, HTML performance reports are no longer optional; they're essential. They help QA teams, developers, and business owners quickly answer:
- Is the application scalable?
- Where is the performance bottleneck?
- How does the system behave under peak traffic?
Before generating HTML dashboards, make sure you've completed the how to download and install JMeter on Windows.
Prerequisites Before You Generate the HTML Report
Before generating your JMeter HTML dashboard, make sure the following are in place:
- JMeter 5.0+ required for dashboard reporting
- JMeter 5.6+ recommended for best stability and features
- Java installed and JAVA_HOME configured
- A valid JMeter test plan (.jmx)
- A results file location for .jtl or .csv output
How to Generate HTML Reports in JMeter (Latest Method – 2025)
If you're using JMeter 5.6 or higher (recommended), the HTML dashboard feature works out of the box; no extra configuration files or plugins are needed.
You can generate reports using:
- Non-GUI Mode (Best for real projects)
- GUI Mode (For quick testing & demos)
Method 1: Generate HTML Report Using Non-GUI Mode (Recommended)
This is the industry-standard method used in:
- Jenkins pipelines
- GitHub Actions
- GitLab CI
- Docker-based test environments
- Cloud performance testing setups
**
jmeter -n -t test.jmx -l results.jtl -e -o html-reportLinux / macOS Command
./jmeter.sh -n -t test.jmx -l results.jtl -e -o html-reportWhat This Command Does
| Flag | Description |
|---|---|
-n | Runs JMeter in non-GUI mode |
-t | Path of your JMX test file |
-l | Location where test results are saved |
-e | Tells JMeter to generate an HTML report |
-o | Specifies the output folder for the report |
Once execution is complete:
- Open the output folder
- Click on index.html
- Your interactive performance dashboard is ready
Method 2: Generate HTML Report Using GUI Mode (Manual Option)
While non-GUI mode is recommended for production usage, GUI mode is still useful for:
- Learning
- Proof of concept testing
- Small demo projects
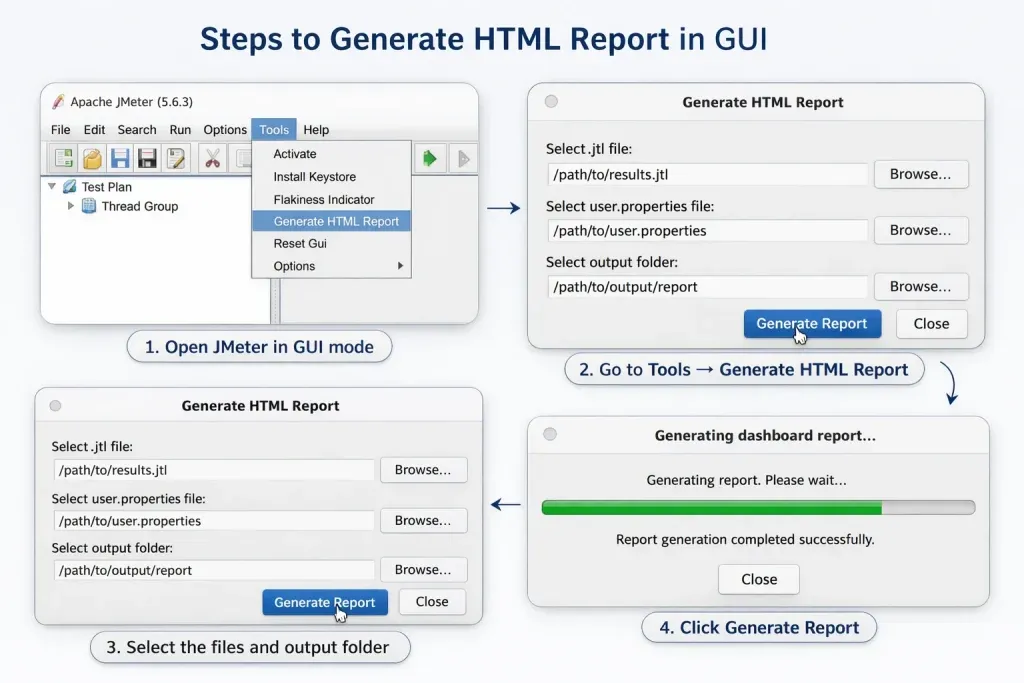
Steps to Generate HTML Report in GUI:

- Open JMeter in GUI mode
- Go to Tools → Generate HTML Report
- Select:
- The .jtl result file
- The user.properties file
- The output directory
- Click Generate Report
Important Tip: Always use the same user.properties file that was used during test execution. Using a different file may cause report generation errors.
Legacy Support (Only for Reference)
For JMeter 3.0 to 5.0
Earlier versions required manually copying settings from:
reportgenerator.properties → user.properties
This step is no longer required in modern JMeter (5.6+).
For JMeter Versions Below 3.0
HTML Dashboard reporting is not supported. Upgrading to a newer version is mandatory for modern performance testing.
Key Advantages of JMeter HTML Reports
Here's why teams worldwide rely on HTML reports:
- Clean and interactive dashboards
- Multiple graph views for deep performance analysis
- Customizable graph properties
- Built-in filters for data segmentation
- Zoom-in feature for bottleneck inspection
- Easy sharing via ZIP file
- Stakeholder-friendly presentation format
To correctly interpret values like throughput, response time, percentiles, and error rate, refer to our guide on key performance testing metrics.
These reports are perfect for:
- Client reviews
- Sprint performance analysis
- Cloud infrastructure validation
- Pre-production load certification
Best Practices for Accurate HTML Reports
To get reliable insights from your JMeter HTML dashboard:
- Run tests in non-GUI mode only
- Avoid using listeners during load execution
- Close unnecessary background applications
- Use realistic user load patterns
- Store results on SSD for faster report generation
- Always run tests with fixed JVM heap size
Troubleshooting Common HTML Report Issues
| Issue | Fix |
|---|---|
| Output folder not empty | Delete it or use -f |
| Wrong user.properties file | Ensure the same file is used during execution and generation |
| Corrupted .jtl file | Re-run test or validate disk space |
| Heavy listeners enabled | Can cause incomplete or slow report generation |
Final Thoughts
Today, HTML reporting in JMeter is no longer an advanced feature; it's a performance testing standard. With modern JMeter versions, you can generate client-ready dashboards using a single command, making performance analysis faster, clearer, and more impactful.
Whether you're testing a single API, a microservices system, or a full-scale cloud application, JMeter's HTML reports give you the visibility needed to make confident business and technical decisions.